 |
A New Approach to Box Design and Woofer Selection
Mark Rumreich |
|
|
A New Approach to Box Design and Woofer Selection
Mark Rumreich |
|
Introduction
This article describes a new way of thinking about speakers. This approach simplifies box design and makes woofer selection straightforward. Most importantly, it provides an intuitive understanding of how boxes and speakers interact. The standard way to describe woofers' small signal characteristics are with Thiele-Small parameters. Thiele-Small parameters aptly describe drivers mathematically but provide only a weak intuitive feel for them. A simple analogy involves another favorite subject of mine. The standard way to describe the size of a pizza is diameter. Diameter is a reasonable thing to measure, but it doesn't provide a good intuitive picture of how many servings there are. (A 14" pizza has twice the number of servings of a 10" pizza for example.) A more useful indicator of what we care about (number of servings) would be area. Similarly, it is possible to define a set of relative performance parameters for speakers. These parameters are easily calculated from the Thiele-Small parameters and provide a convenient and powerful framework for box design and more importantly, woofer selection.
Relative Performance Parameters
The difficulty in using Thiele-Small parameters to compare woofers can be shown with an example. Consider two hypothetical drivers, A and B, with the following specifications:
Inspecting the T/S parameters, woofer A would appear to provide superior low frequency capabilities (based on fs) but require a larger box for an optimum design (based on Vas). Figure 1 shows the frequency response curves for drivers A and B in boxes providing 1 dB of peaking. Notice that system B has a cutoff frequency superior to that of A. Also notice that system B requires a larger box for this alignment. Both of these observations contradict our predictions based on inspection of fs and Vas alone.

Figure 1: Frequency response curves for drivers A and B in boxes providing 1 dB of peaking. The relative performance parameters for drivers A and B are:
Comparing fob (the relative cutoff frequency in the optimum volume box) values of the two drivers indicates that woofer B should provide approximately a 10% lower cutoff frequency than woofer A. Vof (the relative box volume for optimum cutoff frequency) indicates that the enclosure required for woofer B should be about 25% larger than for woofer A. Both of these predictions are consistent with the simulation results. Figure 2 shows each driver in a 0.25 ft3 box. Notice that the cutoff frequencies of the two systems are virtually identical. This is consistent with the virtually identical values of ffb and Vff for the two drivers.

Figure 2: Frequency response curves for each driver in a 0.25 ft3 box. Ffb (relative cutoff frequency in a fixed volume box) and Vff (relative volume for a fixed cutoff frequency) provide two ways of looking at the same thing. They both provide measures of the low frequency performance per box volume - sort of like a "bass per cubic foot" rating. In this case, ffb values of the drivers are almost the same, indicating that for most practical enclosure volumes, the low frequency cutoff of each would be the same. The similar Vff values say that the box volumes would be the same for a particular cutoff frequency. (This does not imply that both systems would have the same Q or port tuning for a specific box volume.)
Box Design
Use figures 3 to 8 for box design. After calculating the relative performance parameters for a driver, refer to the plot with the closest value of Qts. Label the bottom of the plot (x axis) with frequencies based on your calculated value of fob. Label the frequency response curves with box volumes based on your calculated value of Vof.

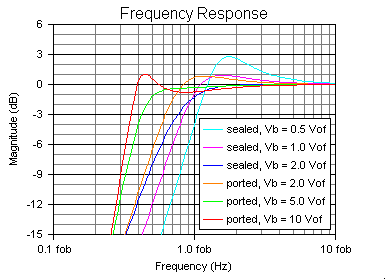
Figure 3: Normalized frequency response curves for Qts = 0.20 Figure 4: Normalized frequency response curves for Qts = 0.30 Figure 5: Normalized frequency response curves for Qts = 0.40 Figure 6: Normalized frequency response curves for Qts = 0.50 Figure 7: Normalized frequency response curves for Qts = 0.60 Figure 8: Normalized frequency response curves for Qts = 0.70 You now have a set of frequency response curves for that driver in different boxes. Notice that the three smaller boxes are sealed and the three larger boxes are ported. (This is because small boxes work better sealed and big boxes work better ported.) For ported boxes, it is necessary to calculate the box frequency using this equation:
The port length (for a pipe) can then be determined using:
where length & diameter are in inches and Vb is in ft3.
Box Design Example
Calculate the relative performance parameters.
Since Qts is 0.37, refer to figure 5 (Qts= 0.40). Figure 9 shows this plot relabeled using frequencies and box volumes based on the RPP's. Looking at the figure, I see that a ported box 1.1 ft3 in volume would produce a -3 dB frequency of about 37 Hz. For this example, I will consider this to be the best tradeoff between box volume and cutoff frequency for my application.

Figure 9: Frequency response curves for Eclipse WO838R woofer. Since a port is required, calculate the box frequency.
For 2" inner diameter PVC tubing, the port length would be:
It is perfectly acceptable to use box volumes between (or beyond) the six shown on the plot. Had I wanted a cutoff frequency of 35 Hz, I would have visually interpolated between the 5Vof and 10Vof curves, and chosen 6*Vof = 1.32 ft3.
The Myth of Discrete Alignments
Figures 3-8 tell a different story. They show that the relationship between response and box volume is continuous, and that a wide range of box volumes can provide acceptable results. The fundamental tradeoff in box design is between box volume and cutoff frequency.
Sealed versus Ported
Sealed boxes offer certain advantages over ported ones. The air trapped in a sealed box acts as a shock absorber which protects the woofer from subsonic energy (such as turn-on thumps) as well as external shocks (like going over a bump in your car). Ported enclosures offer no such protection. A second advantage of sealed systems is their lower sensitivity to driver variations. This means that they are more immune to manufacturing variations, as well as changes in temperature, humidity and aging. When the box volume is close to 2*Vof, you must choose between the additional bass of the ported system and the protection and stability of the sealed system. Sealed versus Ported - Small's Efficiency Bandwidth Product Interestingly, Small proposed a rule of thumb for deciding whether a woofer was better suited for a closed box or vented box. Small defined something called the Efficiency Bandwidth Product, EBP, as fs/Qes. (This is virtually the same as fob which equals fs/Qts.) Small said that an EBP less than 50 favors a closed box, and an EBP greater than 100 favors a vented box. Using EBP as a guideline for choosing a box type can be understood by looking at figures 3 to 8, if we assume that fob approximately equals EBP. If fob is 50 (or lower), a sealed box can provide a cutoff frequency acceptable for most applications. If fob is 100 (or higher), a ported box is needed for adequate bass response. This strategy will provide reasonable bass response in the smallest box. Although the concept of EBP is useful, the assumptions made in formulating Small's guideline may not apply to your situation. For example, you may want a cutoff frequency of 30 Hz which your EBP=50 driver can provide only in a vented box. Alternately, your personal requirements for box size might preclude the use of a vented enclosure for your EBP=100 driver. (Because Vas is not included in the formula for EBP, the EBP guideline is not a good way to incorporate box volume considerations in your design.) Using RPP's for Woofer Selection Where the relative performance parameters really come in handy are for estimating the usefulness of a driver for a particular application. Each of the relative performance parameters is a "figure of merit" which rates driver suitability for an application. Without RPP's, simulation would be required to make any quantitative comparisons of drivers. The most useful RPP's for comparing drivers in the majority of applications are ffb and Vff. The example using figure 2 showed that drivers with the same values of ffb produce similar cutoff frequencies in the same volume box. This is analogous to saying that drivers with the same values of Vff require similar size boxes to provide the same cutoff frequency. Ffb rates the cutoff frequency of a driver in a "reference box" and can be thought of as "bass per cubic foot." A driver with an ffb of 80 will have a cutoff frequency twice that of a driver with an ffb of 40 in the same volume box. Vff rates the box volume required by a driver to provide a reference cutoff frequency. Vff can be considered "cubic feet per bass." A driver with a Vff of 2000 requires an enclosure which is twice the size of one required by a driver with a Vff of 1000, to produce the same cutoff frequency. When using ffb and Vff, it is important to realize that they only apply to drivers in boxes of limited volume. For every driver, there is a box volume where a bigger box no longer provides a significant improvement in the cutoff frequency. This box is called the "optimum box", and its cutoff frequency, the "optimum frequency." Ffb and Vff apply to drivers in boxes smaller than the optimum box. (If this restriction did not apply, it would imply that any driver is capable of providing any desired cutoff frequency if the box is made large enough.) The good news is, the "optimum box" is usually larger than the "desired box." Fob and Vof are also useful for comparing drivers. Fob rates the cutoff frequency of the "optimum box," and Vof rates its volume. The usefulness of them will become more apparent in the next section. Servings versus Area Returning to the pizza analogy, we defined a relative performance parameter called area. What we really wanted to know was the number of servings. What we need is a conversion factor that converts the relative measurement (area) into an absolute measurement (servings). From years of research, the following rules of thumb have been determined:
Suppose you and two friends are having trouble deciding between the 12" and 16" thin crust pizzas. Using a relative comparison, you know that the 16" should provide 201 in2 versus 113 in2 for the 12" - almost twice as much. Since you brought your calculator to Pizza Barn, you quickly determine that:
for the 16" pizza. Perfect! (You congratulate yourselves by calculating what size beer to order.)
Rules of Thumb
Rules of Thumb Examples
The cutoff frequencies and box volumes for "optimum" sealed and ported systems are approximately:
Comparing these numbers to figure 9, the accuracy is quite good. Notice that the ported box is capable of much deeper bass than the sealed box, but at the expense of a tremendous box volume increase. The conversion factors used in the rules of thumb referring to an "optimum box" were chosen to correspond to responses with 1 dB of peaking. This is analogous to saying that the rules of thumb referring to servings of pizza correspond to a "hearty" appetite. The rules of thumb using ffb estimate the cutoff frequency given a box volume. The rules of thumb using Vff estimate the required box volume given the desired cutoff frequency. Both sets of rules apply only to boxes smaller than the "optimum" one, as established by the previous rules of thumb. Suppose I want to know what cutoff frequency the W0838R would have in a 1 ft3 box. First I observe that a port is appropriate for this box volume, based on the Vb>2 Vof criteria. I also notice that the requirement that the box be smaller than the "optimum" ported volume is met. The cutoff frequency is approximately:
Notice that for a ported 1 ft3 box, the cutoff frequency estimate equals simply ffb.
Generalizations
Most of the discussion about the RPP's has involved cutoff frequencies and box volumes. Little has been said about the shape of the frequency response curves. Two drivers with the same RPP's will have the same cutoff frequency/box volume relationship, but different response shapes if their Qts values are different. (This can be seen by comparing figures 3 to 8.) This is because the four RPP's do not fully describe a driver - they actually only define two dimensions of the three dimensional system defined by the T/S parameters. This also means that if you know two of the RPP's, you can calculate the other two! Even though Qts is incorporated in some of the RPP formulas, it's really an independent variable. Be careful when using the relative performance parameters with high Q drivers (Qts>.6). The accuracy of the formulas is reduced when the system Q is not much higher than the driver Q (particularly for ones involving Vof). In addition, since Qtc is always greater than Qts, the desired alignment may not be possible with such drivers.
Conclusion
Box design is a simple process using the RPP's. The RPP's provide guidance for when and how to port. They supply a quick way to estimate performance of a given box or box size needed to provide a certain cutoff frequency. The relative performance parameters are especially useful for judging the usefulness of drivers for a particular application.
References
2. Pat Snyder, "Using Thiele-Small Parameters to Design Loudspeaker Systems," Speakerlab Technical Compendium 11, 1979. 3. Garry Margolis and Richard H. Small, "Personal Calculator Programs for Approximate Vented-Box and Closed-Box Loudspeaker System Design," J. Audio Eng. Soc., Vol. 29, #6, pp 421-441, 1981 June. |
